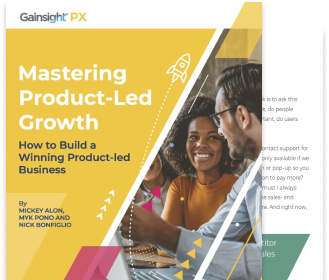
Drive Product Adoption Through Insights
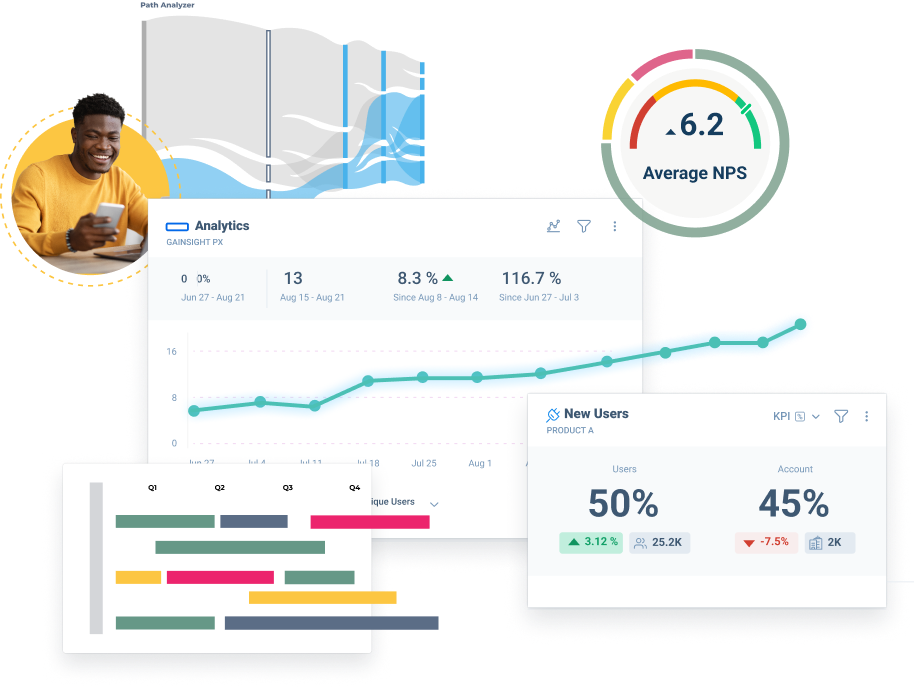
Drill into user retention to learn what features keep users coming back
- Uncover which features correlate with retention to create stickier experiences
- Measure granular funnel steps of feature usage to identify where users encounter friction
- Identify how users organically arrive at your most high-value features so you can design more impactful in-app guides